
Climate change has caused atmospheric temperatures to rise 1.2°C from pre-industrial levels. The Intergovernmental Panel on Climate Change (IPCC) concludes that “even relatively small incremental increases in global warming (+0.5°C) cause statistically significant changes in extremes on the global scale and for large regions”.
Extreme weather events are categorised within the insurance industry as ‘low-probability, high-consequence’, but that probability is only rising. According to the IPCC, the likelihood of heavy rainfall has “increased at the global scale over a majority of land regions”. Models project “a larger fraction of land areas to be affected by an increase in river floods than by a decrease in river floods”.
It is likely, the IPCC reports, “that the proportion of major tropical cyclone intensities, and the frequency of rapid intensification events, have both increased globally over the past 40 years”. It is “virtually certain that there has been increases in the intensity and duration of heatwaves and in the number of heatwave days at the global scale”.
Furthermore, the Ecological Threat Register reports a tenfold increase in natural disasters since 1960. According to the latest World Risk Index report, median disaster risk for the entire planet currently sits at 6.6%, with Oceania and Africa almost three times the median at 15–16%.
Planning, mitigation and resiliency against climate change
Rising threat levels are increasing the pressure on underwriters to underpin decision-making with new approaches and better modelling. When considering the damage caused by natural disasters and extreme weather in a specific location, more granular data needs to be taken into account; factors such as building elevation, soil conditions, local building legislation, and the influence of legacy infrastructure. Such data can determine, for example, which neighbourhoods are more likely to bear the brunt of wildfire damage, or whether a particular area needs to be evacuated in the event of a storm. They can also inform optimal steps required to mitigate such threats.
And to maximise the effectiveness of planning, mitigation and resiliency capabilities, insight into the multidimensional risk from climate change hazards, exposure and vulnerability is vital. RMS, a Moody’s Analytics company, offers forward-looking climate change models built upon 30 years of catastrophe analysis, using millions of data points that reflect engineering, climate science, and financial analysis from real-world damages of extreme events.
The RMS approach helps insurers understand the compounding effects of climate change on hazards such as extreme heat and wildfire; the value of assets at risk, or their exposure; and the susceptibility to damage from the extreme event, or their vulnerability. This three-prong approach most accurately models likely impacts from climate change-related events for insurers to refine their understanding and long-term planning.
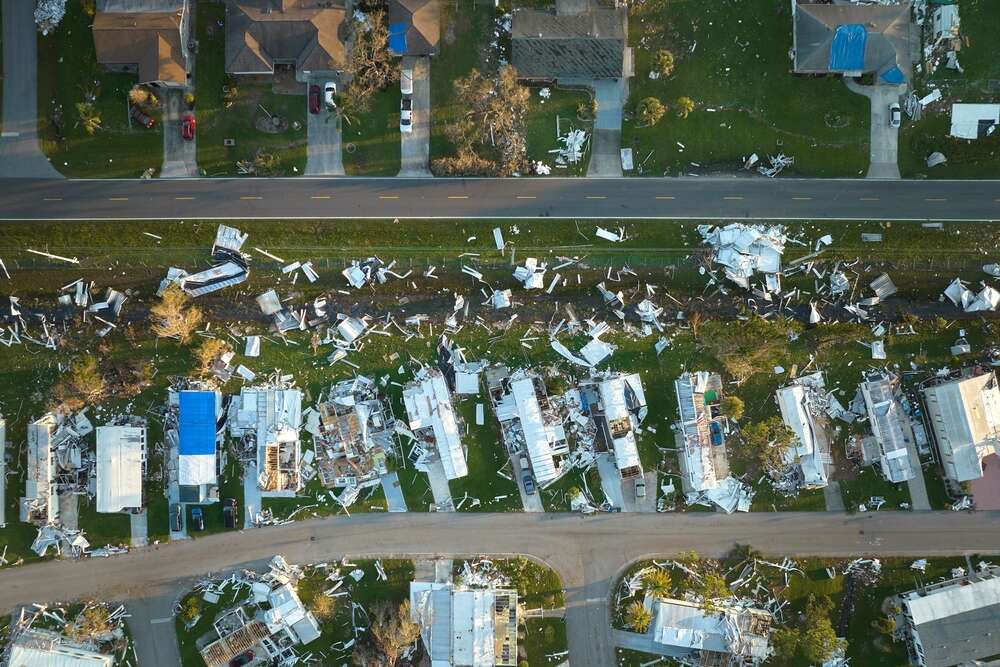
Such requirements were evidenced in the aftermath of the devastation caused by Hurricane Ian. Ian is the fifth-strongest hurricane on record to make landfall in the US, with the brunt of damage being borne by communities on the west coast of Florida. The storm reached Category 4, produced 20in of rainfall, the displacement of 40,000 people, and claimed over a hundred lives.
Putting lessons into practice
RMS estimates a staggering $67bn in insured losses from Hurricane Ian. The region is no stranger to hurricane activity; much of the building stock impacted by Ian was also hit by Irma in 2017 and Charley in 2004. Indeed, Ian was the seventh US major hurricane landfall since 2017.
Ian arrived when the Florida insurance market was already in a precarious state, following a recent spate of insurance company insolvencies over the past couple of years. Prior to Hurricane Ian, six Florida property insurers were declared insolvent in 2022 amid widespread financial problems in the industry.
But, despite these prior experiences, Hurricane Ian has caused perhaps the most devastation of any natural disaster in the state since Hurricane Katrina in 2005. Officials have said that this is due to a lack of preparation, caused in turn by the surprise appearance of the storm so close to Hurricane Fiona a few days previously. But others have pointed to a more fundamental failure to serve evacuation orders fast enough, as well as a suboptimal approach to defending key infrastructure.
Better data analytics and modelling are critically important for empowering the insurance industry to address climate change risk and can help in preparedness for such events and delivering damage reduction.
Insurers, brokers and reinsurers must survey how the risks written today are expected to change over the next few decades on account of climate change. This requires anticipating what lies ahead and actively lobbying for actions that will help sustain insurability and reduce losses. Indeed, the principal response to rising risks associated with climate change will come through “adaptation” – measures taken to bring risk down to tolerable levels. Risk modelling must measure the potential impacts of various interventions, factoring in how risk is expected to change over time.
In protecting against such devastation, free and widely available technology can provide detailed satellite imagery, allowing for initial desktop analysis of the risk factors associated with individual properties. And while more complex information to do with building code violations will not be immediately visible using these tools, factors such as tree cover protecting buildings from floods and exposure to fire risk can all be measured at a distance.
More complex risk analysis requires satellite imagery from more sophisticated platforms; applying machine learning and AI technologies to assess damage quantification and differentiation from the imagery provided; and increasing the speed and efficiency with which these capabilities can be carried out.
Complexities in measurement
Perhaps one of the most difficult perils to measure is wildfire. This is because, by its nature, wildfire is incredibly data-intensive and the risk profile can vary widely, even within the same locale. In a 2022 report, the UN Environment Programme forecasts a global increase of extreme fires of up to 14% by 2030, 30% by the end of 2050 and 50% by the end of the century.
What natural disasters of this type require, then, is location-level data that in risk assessment can make a considerable difference between total loss, partial loss and zero loss. To address this, RMS released its US Wildfire HD Model in 2019, built to capture the complex behaviours that make fire spread; ember accumulation and smoke dispersion are difficult metrics to quantify. By encompassing surface fuels, topography, weather conditions, moisture and fire suppression measures, the model has been able to simulate over 72 million wildfires across the US and can be adapted to other locations accordingly.
Better insight to better understand climate change impact
Insurers will not only face increasing threats of cost spikes and uncertainty with climate change, but also mounting pressures to address these risks in their business strategy. Shareholder preferences are changing and in many cases demanding transparency in climate change strategy, the worldwide regulatory landscape is evolving, and increasingly requiring assessment of financial exposure to climate change impacts, and lessons from major catastrophes of the past five years demand insurers take action to protect their top and bottom lines.
Modelling that accounts for the compounding and interrelated risks of climate change will help insurers refine their business strategy proactively. These tools will help evaluate the insurability of portfolios over time as risks evolve over the next decades. The insight can also be a powerful market-moving mechanism in proving cost-benefit analysis of adaptation measures such as flood walls or rising property elevations relative to the risk of damages and loss.


